Using the LUT Editor
In image processing, LUT stands for Look-Up Table function. Dragonfly's LUT functions, which determine how regions within specific arrays of intensity or scalar values are displayed and colored, can be applied and edited interactively to optimize the 2D and 3D views of datasets and other objects. Depending on which look-up table you choose, the difference between the original and remapped version can be subtle or very dramatic.
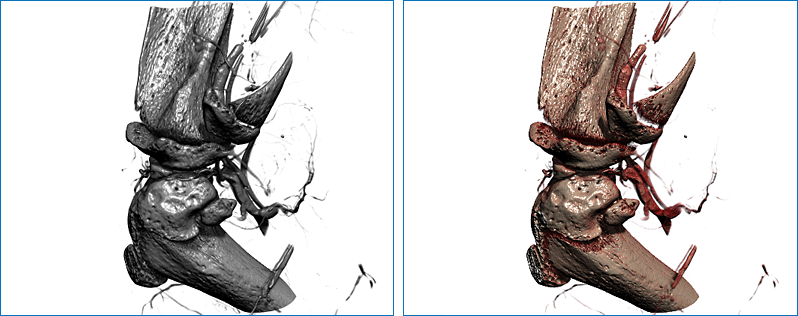
In the example below, the original grayscale LUT was edited so that bone and soft tissue are colored more realistically.
Default grayscale LUT (on left) and edited LUT (on right)
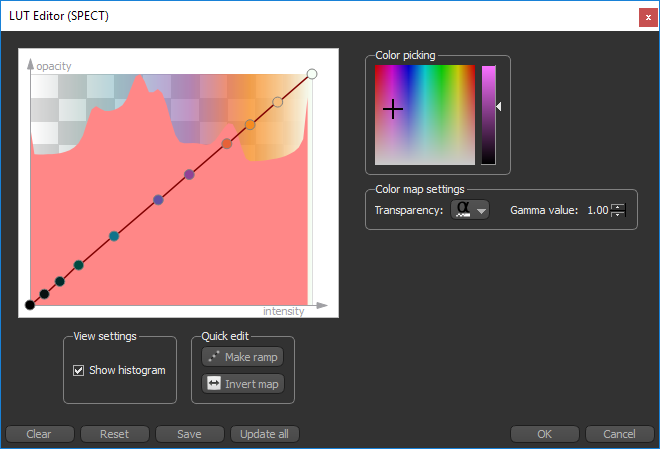
The LUT Editor, shown below, displays a plot of the current image’s look-up table (LUT) that describes the shade or color that is displayed for each of the possible pixel values. By manipulating the LUT settings, the best overall contrast between various features can be achieved. You can edit any of the available LUTs, create your own, or download LUTs from the Infinite Toolbox (see Infinite Toolbox).
With a dataset selected, click the Edit button in the 2D settings box or 3D settings box on the Data Properties and Settings panel to open the LUT Editor, shown below.
LUT Editor
|
|
Description |
|---|---|
|
Histogram |
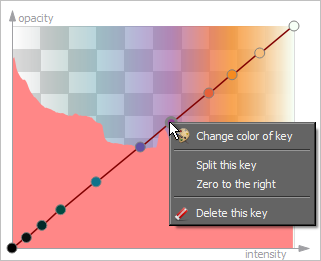
Plots the intensity values of the current image and displays the selected transfer function. The histogram is a virtual representation of the distribution of pixels in an image. This representation is horizontally graphed according to light and dark; the darker sections are towards 0 (complete black) and the lighter regions towards the maximum (complete white). The vertical spikes represent the quantity of pixels in that range of either light or dark. The look-up table maps the input values of a single component to new values (R, G, B or A) in the same component. It can represent color corrections, contrast adjustment, and brightness changes. Keys can be inserted to highlight regions of interest within specific arrays of intensity, as required. By resizing regions you can modify the intensity slope and intensify certain values within the specified range. You can edit the keys directly or you can use the items in the Histogram context menu, shown below, to edit keys.
Change color of key… Opens the Select Color dialog, in which you can select colors or apply predefined and saved custom colors to a key. See Choosing Colors for more information about the Select Color dialog. Split this key… Splits the selected key into two halves. You can change the color of each half, as well as its opacity. Zero to the right… Sets the key to the right of the selected key to an opacity value of 0. Delete this key… Deletes the selected key. |
|
View settings |
Show histogram… Toggles the visibility of the histogram on and off. |
|
Quick edit |
The Quick edit controls let you switch the current ramp to a linear function and to invert the current mapping. Make ramp… Resets the current ramp to a linear function that is graphed as a 45° straight line. Invert map… Inverts the grayscale or color map of the image so that light areas of the rendered object appear dark and the dark areas appear light. Click the button again to reset the image. |
|
Color picking |
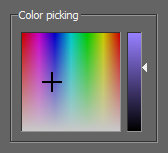
Lets you choose a color or shade for a selected key.
To choose a color for a selected key, simply click the shade you want in the large color box. You should note that hue saturation increases from bottom to top and that brightness can be adjusted with the slider on the right. Additional controls for choosing colors, as well as applying custom colors, are available in the Select Color dialog. You can access this dialog in the Histogram context menu. |
|
Color map settings |
These options determine how the map settings are applied to the histogram. Transparency… Determines how the histogram appears — Transparent, Use Alpha, or Opaque. Gamma… Controls overall brightness. Although the greatest effect of Gamma is to a change in overall brightness, varying the amount of Gamma correction can also change the ratios of red to green to blue. |
A number of options are available in the LUT Editor to update all instances of an edited LUT or to save the current LUT.
|
|
Description |
|---|---|
|
Clear |
Clears the settings of the current LUT and applies the default grayscale LUT, which is a linear function and is graphed as a 45° straight line. |
|
Reset |
Applies the original settings of the selected LUT. |
|
Save |
Provides options to save the settings of an edited LUT or to create a new LUT (see Saving LUTs). |
|
Update All |
Updates all instances of the edited LUT. |
|
OK |
Applies the edited settings of the selected LUT to the current view and closes the LUT Editor. |
|
Cancel |
Cancels all edits and closes the LUT Editor. |
You can edit any of the available LUTs to improve the visualization of 2D and 3D images, multi-ROIs, scalar meshes, vector fields, and graphs.
- Select the required dataset, vector field, or graph in the Data Properties and Settings panel.
- Do one of the following:
- For a selected dataset, choose a LUT in the 2D settings or 3D settings box.
- For a selected vector field, choose a LUT in the Vector Field settings box.
- For a selected graph, choose a LUT in the Graph settings box.
NOTE In general, you should edit the LUT that produces the best initial results.
- Click the Edit button.
The LUT Editor appears.
- Choose the Color map settings — Transparent, Use Alpha, or Opaque, as well as the Gamma value — if you need to change the histogram representation.
- Add keys, as required.
- To add a key, click anywhere inside the histogram.
- Modify keys by changing the opacity associated with its value and/or by assigning it a color.
- To modify the opacity setting, drag the key up or down. You can constrain the key vertically by holding down the Shift key while you work.
- To choose a color for a selected key, you simply click the shade you want in the color box. You should note that hue saturation increases from bottom to top and that brightness can be adjusted with the slider on the right.
- You can also modify keys with the options available in the contextual menu. Refer to the table LUT Editor properties for information about the contextual menu options.
- Do one of the following:
- Click OK to apply your changes to the current view.
- Click Update all to apply your changes to all instances of the edited LUT.
- Click Save if you want to save the changes you made to the LUT (see Saving LUTs).
You can edit any of the available discrete LUTs to improve the visualization of 2D and 3D images, multi-ROIs, scalar meshes, vector fields, and graphs.
- Select the required dataset, vector field, or graph in the Data Properties and Settings panel.
- Do one of the following:
- For a selected dataset, choose a Discrete LUT in the 2D settings or 3D settings box.
- For a selected vector field, choose a Discrete LUT in the Vector Field settings box.
- For a selected graph, choose a Discrete LUT in the Graph settings box.
NOTE In general, you should edit the Discrete LUT that produces the best initial results.
- Click the Edit button.
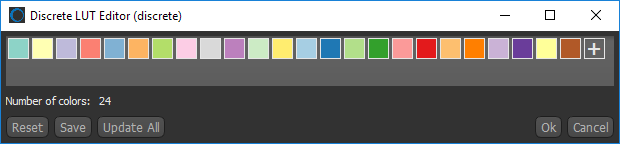
The Discrete LUT Editor appears.
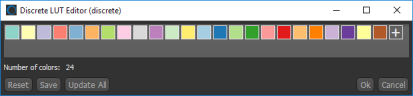
- Do the following, as required:
- To change a color, click the required color swatch and then choose a new color in the Color dialog (see Choosing Colors).
- To add a new color, click the "+" box and then choose a new color in the Color dialog (see Choosing Colors).
- Do one of the following:
- Click OK to apply your changes to the current view.
- Click Update all to apply your changes to all instances of the edited Discrete LUT.
- Click Save if you want to save the changes you made to the Discrete LUT (see Saving LUTs).
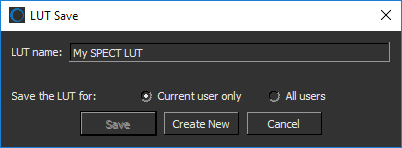
Once a good set of LUT settings has been established, you can save the settings to the current LUT or create a new LUT. These options are available in the LUT Save dialog, shown below.
LUT Save dialog
- Edit the LUT, as required.
- Click the Save button in the LUT Editor or Discrete LUT Editor dialog.
The LUT Save dialog opens.
- Enter a name for the LUT in the dialog, if you plan to create a new LUT.
- Select how you want to save the LUT — for the current user or for all users.
NOTE LUTS saved for the current user are saved in
AppData\Local\ORS\DragonflyXX\LUTs, while LUTS saved for all users are saved inProgramData\ORS\DragonflyXX\LUTs. - Do one of the following:
- Click Save to apply your changes to the current LUT.
- Click Create New to save your changes as a new LUT. Whenever you create a new LUT, it will be applied automatically to the current view.